
India's summer arrives early, and a Super El Nino is brewing
Heat waves have hit 11 states. Banda, in UP, touched 47.4°C. And forecasters say a possible Super El Nino could stretch the heat through 2026.


In Banda, Uttar Pradesh, the thermometer registered 47.4°C on April 25 — about ten degrees above the human body’s temperature — the hottest reading anywhere in India this year.
Across most of the country that day, daytime highs sat between 40 and 45°C. The India Meteorological Department flagged heat-wave conditions in 11 states and union territories, including Punjab, Haryana, Delhi, Rajasthan and Uttar Pradesh.
And it could get worse: a possible Super El Nino later in the year could keep the heat going and weaken the monsoon that delivers nearly 70 per cent of India's rainfall.
A weaker monsoon means smaller harvests, tighter water rationing, and power cuts just as households crank up fans and air conditioners. Agriculture alone is roughly 18 per cent of India's $4 trillion economy and employs close to half of its more than 1.4 billion people.
This isn't exclusively an India story. The heat now baking the plains is one piece of a bigger pattern that began far to the north — in Siberia — six weeks ago. Start there.
Planet ran a fever in March
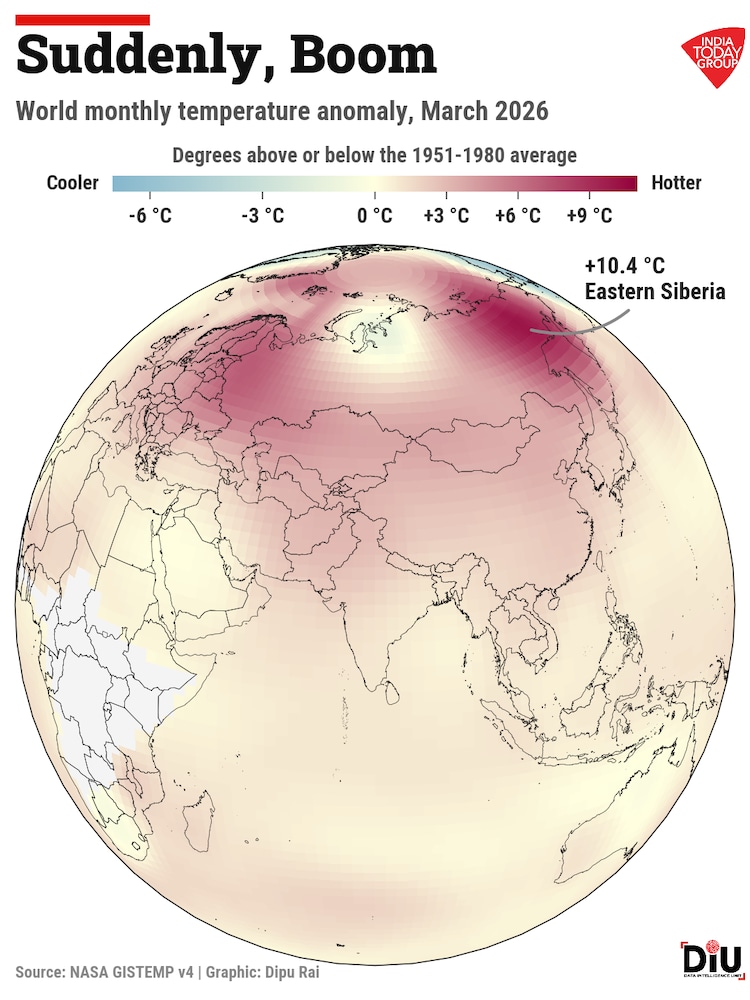
That globe above is centred on India and shaded by how much hotter (or cooler) each part of the world ran in March compared with the long-term average. Cream is normal, blue is colder, red is hotter. The angry red blot at the top right is eastern Siberia.
One patch of Yakutia (a republic of Russia) ran a stunning 10.4°C above its usual March temperature, the most extreme departure from normal anywhere on the planet that month.
Globally, the planet ran 1.27°C above its 1951–1980 average, NASA's GISTEMP record shows. It’s one of the warmest Marches in the satellite era.
The European Union's Copernicus climate service, working from a different analysis and a longer 1850–1900 yardstick, called it the fourth-warmest March on record, at 1.48°C above pre-industrial.
Yakutia's heat-dome was no rogue pixel either. Four neighbouring grid cells around ran between +10.3°C and +10.4°C for the month. Climate-attribution scientists writing in Eos called a warming that large "virtually impossible without human-induced climate change."
World on fire
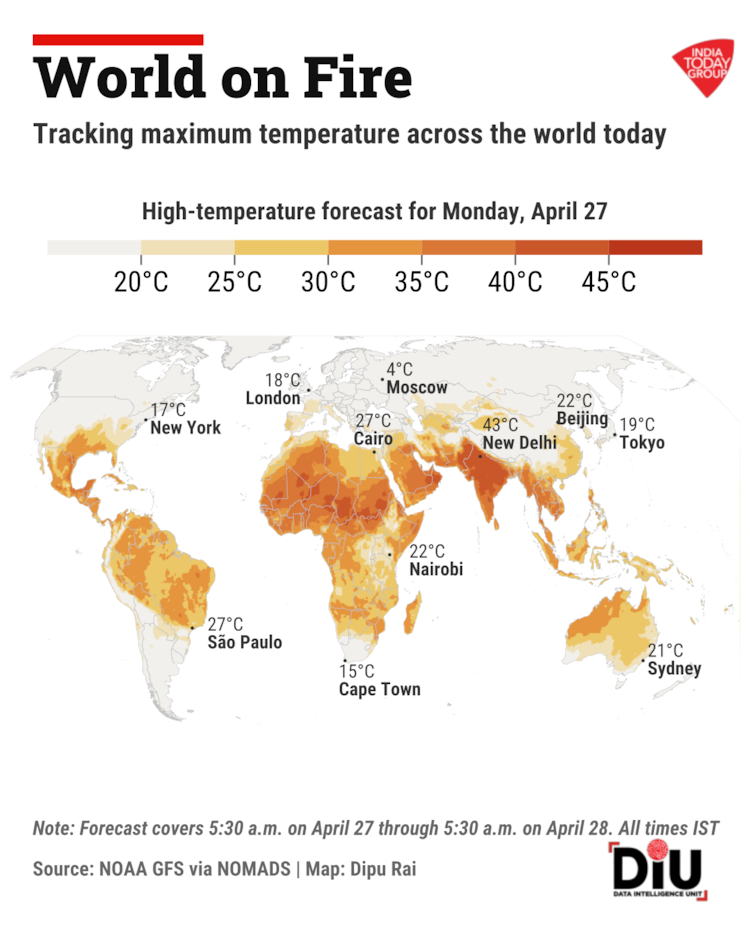
This map shows where the planet runs hottest today, April 27, using the US National Weather Service's daily forecast. Light yellow gets you to 30°C; orange means 40; the deepest browns and reds, across north India, the Sahel and parts of the Arabian Peninsula, are 45°C and above.
Look at New Delhi: the model puts it at 43°C for the day. This is a forecast for the model's grid cell over Delhi — not a thermometer reading from a station. The IMD's most recent bulletin, issued April 26, recorded Delhi's Safdarjung observatory at 42.8°C on April 25. That's 5.1°C above its normal, a reading that meets the IMD's heat-wave criterion. Both numbers are real; they come from different methods, and the story names both.
India is glowing
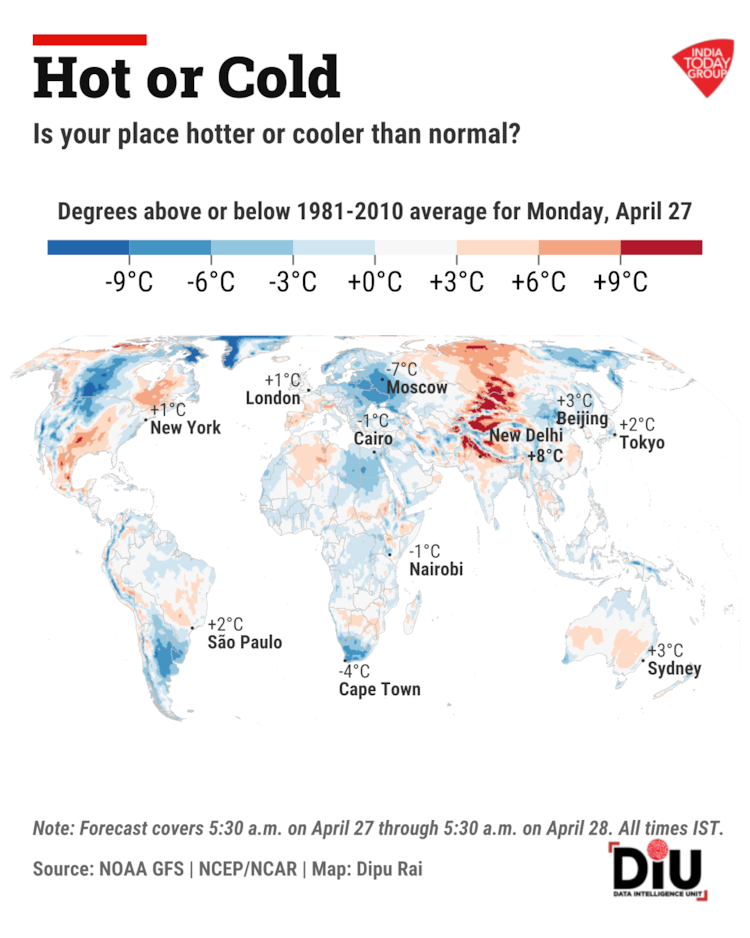
Same day. Same map. But this time, each city's normal, based on 1981–2010 data, has been subtracted out. So red here doesn't mean "hot". It means "hotter than usual for this date."
A 35°C day in Delhi in May is routine. The same day in London would be a national emergency. This map strips heat out of geography. What's left is deviation from normal. Cool blues run across western North America. Deep reds spill across Eastern Europe into Russia. And a thick orange ribbon stretches across north India, the same hot zone NASA's monthly globe flagged a few weeks earlier.
Different dataset, different time window, same story.
India's heat wave, day by day
This animation strings together the past 14 days of India's daily high temperature map, then runs five more days into IMD's own forecast, through May 2. Each frame is one day. The deeper the red, the higher the daily high.

What you see is what IMD's bulletin says in words. On April 25, daily highs ran 40–45°C across most of the country, peaking at 47.4°C at Banda in Uttar Pradesh. By 2.30 pm on April 26, 46.4°C at Amravati in Vidarbha had taken the day's top spot.
The IMD calls it a heat wave when a station's daytime high climbs at least 4.5°C above its normal, or actually touches 45°C. A severe heat wave is 6.5°C or more above normal, or 47°C in absolute terms. Banda's 47.4°C clears that bar.
Heat wave conditions were already in force on April 26 across 11 states and union territories: Punjab, Haryana, Chandigarh and Delhi, Uttar Pradesh, Rajasthan, Madhya Pradesh, Vidarbha, Bihar, Gujarat, and Jammu-Kashmir-Ladakh. Two regions, Himachal Pradesh and East Uttar Pradesh, were under severe heat-wave advisories.
Then watch the cool-down kick in. The deep-red blanket holds across the north-west through April 28, eases by 3–5°C between April 29 and 30, as a weak western disturbance arrives, and warms again 2–3°C on May 1 and 2.
By May 1, the bulletin issues no heat-wave warning at all, but the cycle is turning, not gone.
Delhi, every day, since 1991
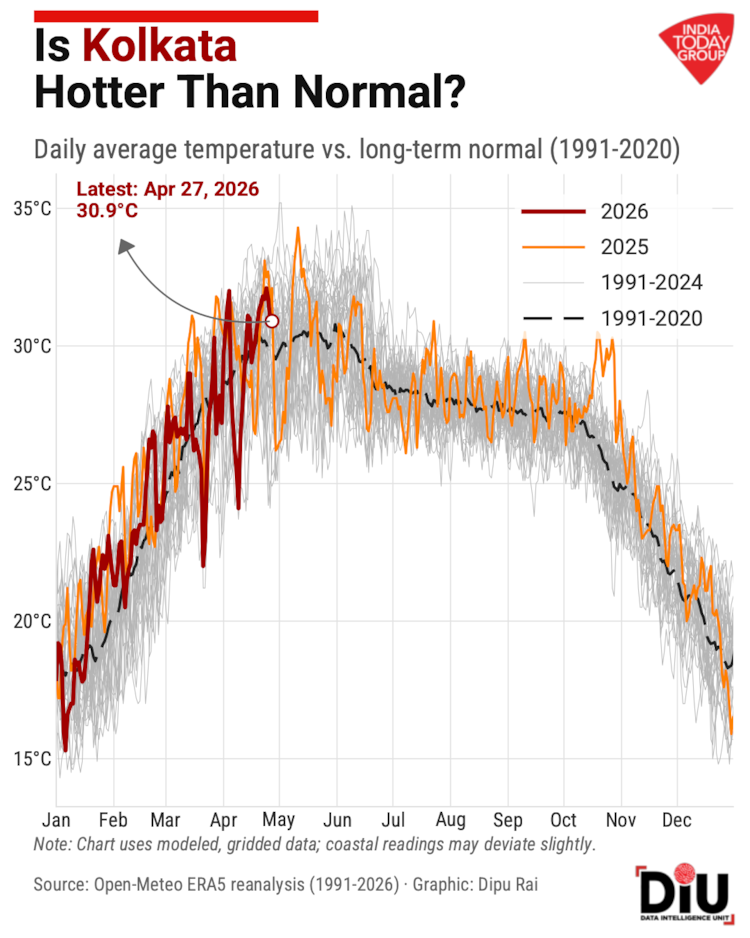
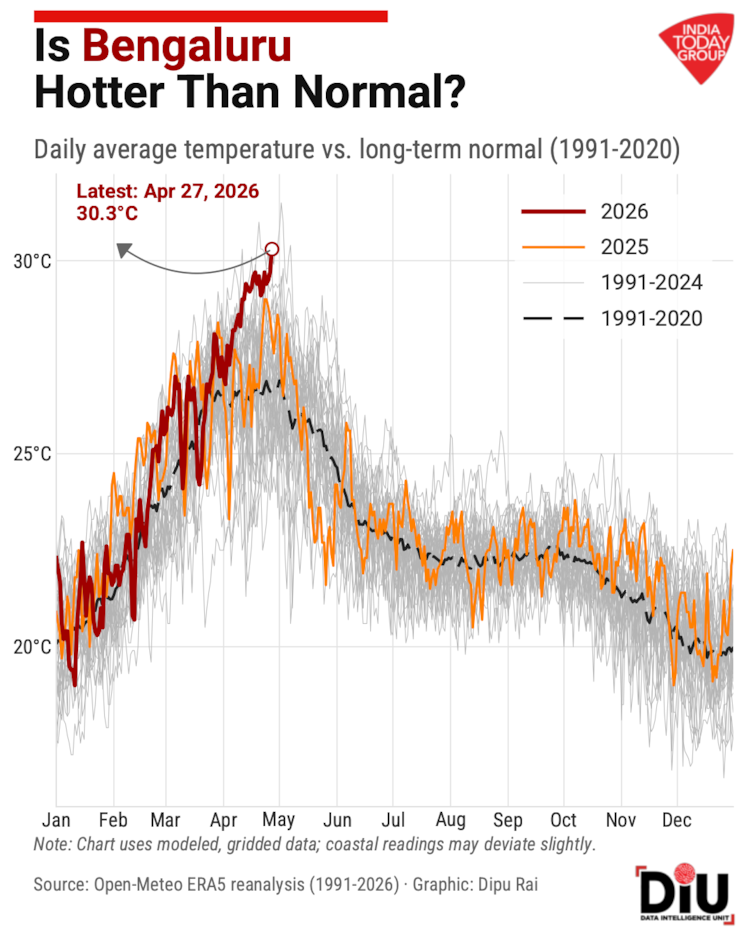
Now zoom all the way in to a single city, every day, for 35 years. Each grey line is one prior year of Delhi's daily mean temperature. The orange is 2025. The dark red is 2026. The dashed black line is the average, what you'd expect for a given date if you took the past three decades and averaged them.
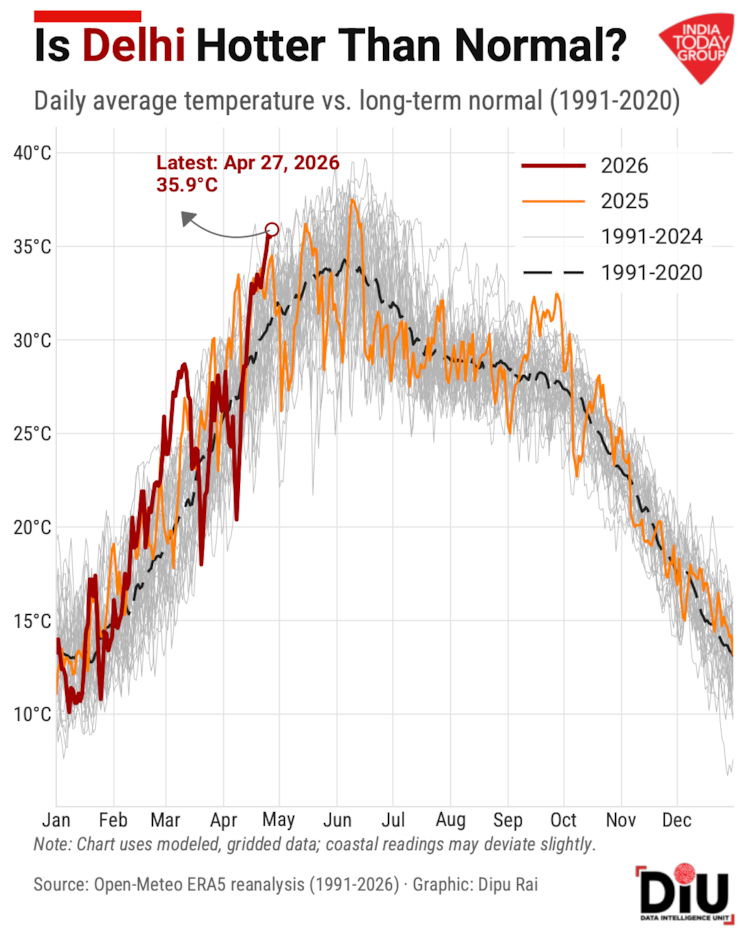
Through winter, 2026 was running with the crowd. Since late February, it has lifted above the average and stayed there. The most recent reading, for April 27, is 35.9°C, near the top of the grey cloud on that calendar day.
The same chart is ready for Mumbai, Kolkata, Chennai, and Bengaluru. As of April 27, those cities sit at Mumbai 30.1°C, Kolkata 30.9°C, Chennai 31.0°C, and Bengaluru 30.3°C, comfortably inside their grey clouds, but the early-summer ramp is still ahead.

A small note on numbers: This chart's "daily mean" is an average of all 24 hourly readings over the day, taken from a global weather model (Open-Meteo's ERA5/IFS blend). IMD's station bulletins, by contrast, report a station's "mean" as roughly (the day's high + the day's low) divided by two.

The two methods can differ by 1–2°C on the same day; for Delhi’s Safdarjung on April 26, the IMD's average works out to about 34.2°C; the chart's grid-based average for the same day was 35.5°C. Both are right, in their own way.
What this could mean for India
The IMD's outlook for the April-to-June window builds on three risks:
- Heat-wave days are already here: Eleven states and Union Territories were under heat-wave or severe heat-wave warnings on April 26 and 27. Northwest India holds through April 28 before a 3–5°C cooling on April 29–30, and another warming spike on May 1–2.
- Possible Super El Nino: If the strongest model scenarios verify, the heat could extend later into the year and produce hotter nights across the plains. The IMD's bulletin already records "warm-night" conditions over Punjab, Haryana, East Uttar Pradesh, West Madhya Pradesh, and Rajasthan on April 26, and "severe warm-night" conditions over isolated pockets of West Uttar Pradesh.
- Below-average monsoon: Less rainfall would mean drought risk for the agricultural sector, and more pressure on water and power supplies that already run tight in summer.
None of this is locked in yet. A strong monsoon arriving on time could loosen pressure quickly. The grey cloud tells you, day-by-day, which path 2026 is along.
Note: When the same metric, like a city's daily high, is reported by both a grid model and a station thermometer, this story names both and notes that the two can legitimately differ by 1–2°C on the same day.